Systems Thinking
I took a speed reading course and read “War and Peace” in twenty minutes. It involves Russia.
—Woody Allen
“No matter what we do, the number of defects in our backlog remains about the same,” a manager told us; this for a 15 MSLOC C and C++ product with several hundred developers where we were working. What’s going on? Systems thinking may help. In small groups the forces at play are more quickly seen and informally understood, but in large product development—or any large system—it’s tough. Gerry Weinberg highlights two decisive factors in this situation:
Weinberg-Brooks’ Law: More software projects have gone awry from management’s taking action based on incorrect system models than for all other causes combined.
Causation Fallacy: Every effect has a cause… and we can tell which is which. [Weinberg92]
These reflect the impact of our mental models on the system, a subject that will be revisited later in this section.
Problems stemming from mental models and assumptions are one issue. Another is that large-scale adoption of Scrum, lean thinking, and agile principles is not isolated to the development group. It bumps into product management, budgeting, beta-testing, launch, and governance and HR policies. Accordingly, in large-scale agile adoption it is useful to be able to get together with colleagues and effectively reason about the mental models, causal relations, feedback loops, and control mechanisms (or illusions of control) in a big system that is about to be seriously perturbed. Systems thinking is one of those reasoning tools.
In 1958, the Harvard Business Review published “Industrial Dynamics: A Major Breakthrough for Decision Makers,” a landmark paper by Jay Forrester, MIT Sloan School professor. This paper spurred the movement of systems thinking in business education, and the MIT Sloan School of Management became known for educating people in system dynamics. System dynamics is sometimes treated as a synonym for systems thinking , though the latter is a more general term.
MIT also attracted other system-dynamics-oriented researchers such as Peter Senge.1
Consistent with Weinberg-Brook’s Law, Forrester’s research showed that decision makers who were given dynamic models of a business system and asked to improve their output performance, usually made them run worse [SKRRS94]. The observation was that most people have weak judgement on how to fundamentally improve systems, usually applying incorrect “common sense” and quick-fix ‘solutions’ that do not create long-lasting systemic improvement.
Why is the behavior of a large development group (a system) not understood or guided skillfully? The answer lies, in part, in the behavior of stochastic systems with queues and variability, as explored in the Queueing Theory LeSS principle. And the same answer lies in control theory: Most systems of interest—such as a product development group—have complex positive and negative feedback loops and nonlinear behavior. The behavior of these systems defies our gut instinct. And then there is the minor issue of people.
In summary, reasons for not being skillful in fathoming or guiding a big system include (but are not limited to):
- lack of knowledge about the system dynamics, feedback loops, nonlinear systems behavior, and unintended consequences in workplace systems
- not understanding root causes of problems (and how to find)
- causes, not cause; in systems thinking one sees that there are multiple, indirect, and dynamic causes to problems
- not knowing if or why quick-fix or local-department decisions degraded overall delivery performance.
In short, not being systems thinkers.2
These reasons are consequential at the intersection of management and large-scale adoption of lean and agile principles. The leadership team is part of the system being perturbed; if they do not apply systems thinking, they could really perturb it—and not in a good way!
As a summary of systems thinking insight, we like the 11 ‘laws’ described in The Fifth Discipline:
- Today’s problems come from yesterday’s ‘solutions.’
- The harder you push, the harder the system pushes back.
- Behavior will grow worse before it grows better.
- The easy way out usually leads back in.
- The cure can be worse than the disease.
- Faster is slower.
- Cause and effect are not closely related in time and space.
- Small changes can produce big results…but the areas of highest leverage are often the least obvious.
- You can have your cake and eat it too—but not all at once.
- Dividing an elephant in half does not produce two small elephants.
- There is no blame.
Toyota’s internal motto is “Good thinking, good products.” Systems thinking is a set of thinking tools to help…
- see system dynamics—a development organization is a system of people and policies with subtle feedback loops and unintended consequences
- we can learn to see and thus improve the system with causal loop diagrams created in a workshop
- see mental models—one reason behind suboptimal decisions is mistaken assumptions and faulty reasoning
- causal loop diagramming and Five Whys expose these
- see local optimization—another source of suboptimal decisions is local optimization , making the ‘best’ decision from the viewpoint of a person or department, rather than global optimization for the lean systems-level goal of deliver value fast with high quality and high morale .
This introduction is organized around the following areas in systems thinking: Learning to see (1) system dynamics , (2) mental models , (3) root causes , and (4) local optimization .
Seeing System Dynamics: Introduction
Static versus Dynamic Complexity
Many of us, especially in engineering and finance, are educated to master complexity of static details—learning to analyze and manage information (requirements, financial analysis, …), decompose complex structures into simpler ones, and so forth. That is, complexity of a static, information, or structural nature.
Why do big software systems tend to degrade, with more and more time spent on defects? What might happen if the USA invades Iraq? Seeing the dynamics behind these questions involves analysis of the complexity of dynamics .
In contrast to static-details education, many of us receive no formal education in analyzing dynamics complexity3, especially workplace dynamics. Perhaps there is a belief it is sufficient to rely on common sense in the workplace. Forrester demonstrated that “common sense” is just not so in complex systems, and showed it is possible to formally educate people to become better system dynamics thinkers in the workplace using dynamic system models visualized in flow diagrams [Forrester61].
Flow diagrams encompass material, financial, and information flows, stocks (variables with a quantity, such as cash or number of defects), the impact of decisions and policies, and cause-effect relations. A popular simplification is the causal loop diagram that focuses on cause-effect relationships and feedback loops in a system [Sterman00]. There are a variety of similar notations; they all show stocks (variables), causal links, and delay. In [Weinberg92] this is called the diagram of effect .
The First Law of Diagramming: Model to Have a Conversation
A tool to learn to see system dynamics is a causal loop diagram, ideally sketched on a whiteboard in a LeSS Overall Retrospective with colleagues. Before going further, here is the First Law of Diagramming
The primary value in diagrams is in the discussion while diagramming—we model to have a conversation.
When a group gets together to sketch a causal loop diagram on a whiteboard (See it is the the acts of discussing and thinking that are most important when diagramming, Valtech India.), the primary value is the conversation and shared understanding they arrive at while creating the model. Its visualization as an easy-to-see diagram is important to make concrete and unambiguous (on the whiteboard) the ideas—the mental models people have—because words alone can be fuzzy and misunderstood. But still, the diagram is secondary to what people take away: learning and a revised understanding through a discussion.
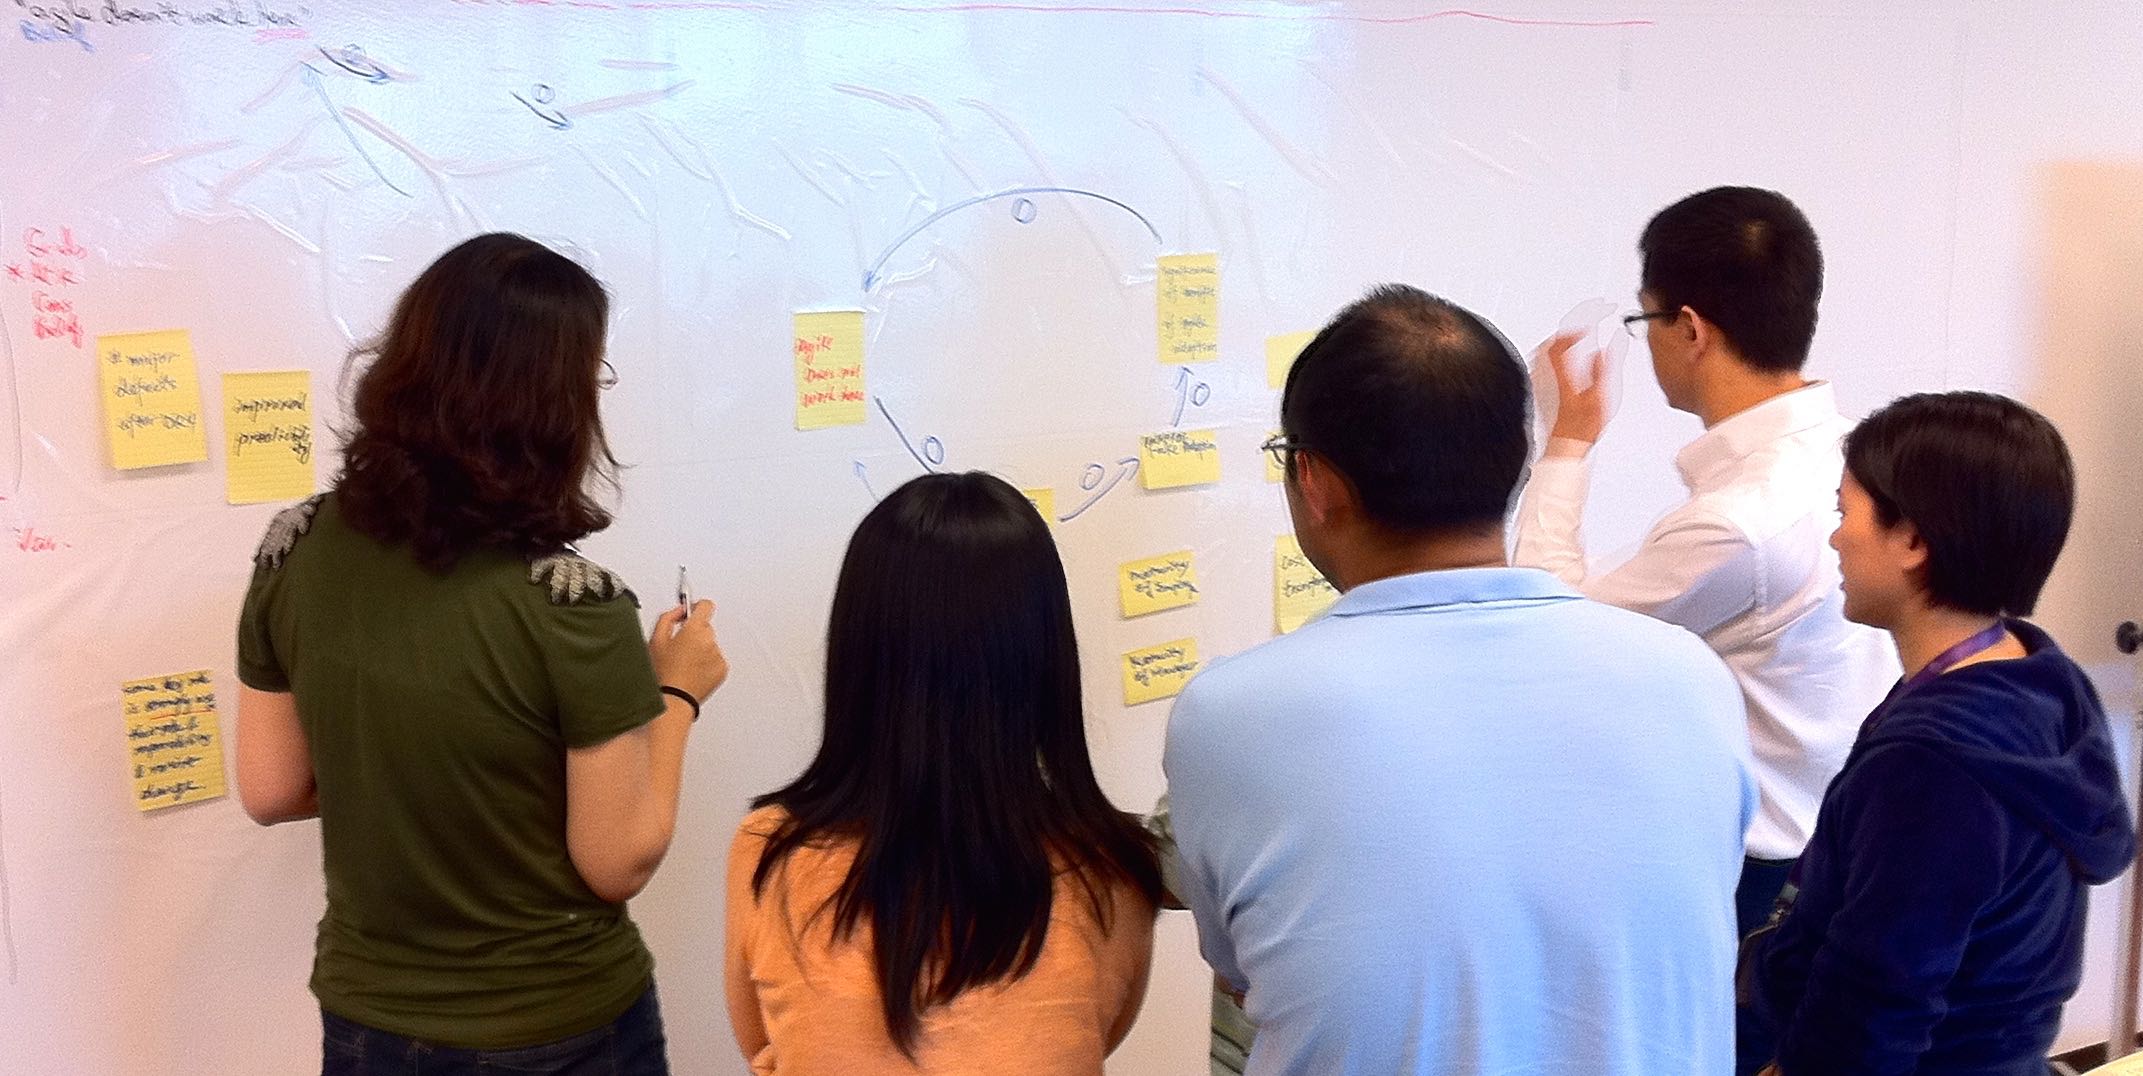
Concrete modeling tip : We start by writing on sticky notes to define variables . A note might read “feature velocity” or “# defects.” We place these on a whiteboard. Then we sketch causal link lines between the sticky notes. There will be (or should be) lots of rewriting, erasing, and redrawing during the modeling session. The most meaningful outcome is understanding ; in addition, some participants will want to take a digital photo of the whiteboard sketch.
Seeing System Dynamics: Causal Loop Diagrams
Causal loop diagrams are used regularly in introductions to LeSS, to help see the dynamics of what is going on in large-scale development. It is useful to understand them for that reason alone. And more useful to you, we recommend you do these together with colleagues at a whiteboard. Model to have a conversation. When? Probably during a LeSS Overall Retrospective.
The practical aspect of this tip is more important than may first be appreciated. It is vague and low-impact to suggest “be a systems thinker.” But if you and four colleagues get into the habit of standing together at a large whiteboard, sketching causal loop diagrams together, then there is a concrete and potentially high-impact practice that connects “be a systems thinker” with “do systems thinking.”
The following examples seem sterile when presented in a book. But imagine you were at a whiteboard with other people and the diagrams were being sketched during a lively conversation. That’s the way we suggest ‘doing’ systems thinking.
Notation and Examples
Causal loop diagrams contain many elements; the following common useful subset is explored through a scenario.
- variables
- causal links
- opposite effects
- constraints
- goals
- reactions; quick-fix reactions
- interaction effects
- extreme effects
- delays
- positive feedback loops
The following simplified scenario is for a particular organization. It is not a generalization.
Variables—Causal loop diagrams include variables (or stocks) such as the velocity (rate of delivery) of software features and number of defects . Variables have a measurable quantity.

Causal links—An element can have an effect on another, such as if feature velocity increases, then the number of defects increase; that is, more new code, more defects.

Now it is time to bump into Weinberg-Brook’s Law and the Causation Fallacy . It is easy to sketch a diagram; it is something else to model with insight. For example, consider the relationship between the number of developers and feature velocity.
The nature of any cause-effect relationship is actually not obvious, though it is common for people to jump to conclusions such as more developers means better velocity. Adding people late in development may reduce velocity (a sub-element of “Brooks’ Law” [Brooks95]). Or, more bad programmers could really slow you down. An argument can be made that removing terrible developers can improve velocity.

Opposite effects—A causal link effect may be the same or opposite direction; if A goes up then B goes up, or vice versa. Opposite effect is shown with an ‘O’ on the line. Suppose defects going up puts a drag on the system, lowering the velocity of new features because people spend more time fixing or working around bugs.

Constraints—Unless you can find people to work for free, there is a constraint on the number of developers, based upon cash supply.
Constraints are not causal links. As cash supply goes up, it is not the case that the number of developers goes up.

Goals and Reactions–People, departments, and systems have goals, such as higher feature velocity . Goals often generate pressure for people to react (or act), with the intent of achieving the goal. But since there is Causation Fallacy and Weinberg-Brooks’ Law to contend with, people should be cautious about assuming what actions will help. Now a goal and pressure for reaction is shown:

Not only does a goal with a reward create pressure to act, but also it creates pressure to appear to be acting and achieving, due to the measurement dysfunction generated by rewards. And the measurement dysfunction can be proportional to the perceived value of the reward because people are being motivated to get a reward, not to improve the system [Austin96]. Notice how rewards can actually degrade system performance. Visually, the system dynamics may be…
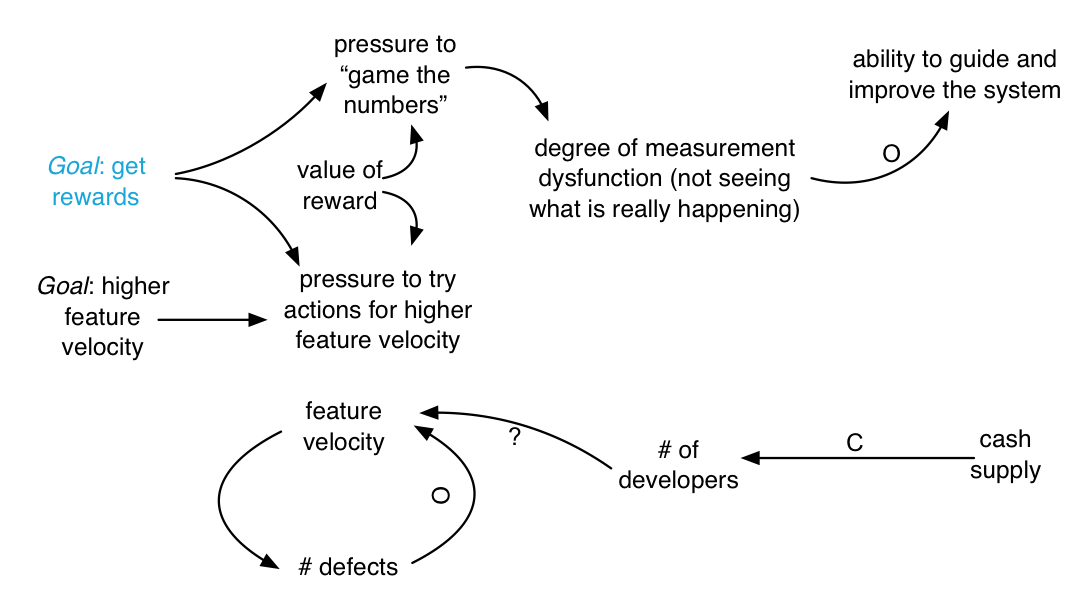
It is quite interesting that all these dynamics have been added by introduction of reward, and yet there is no necessary connection between the top part of this model and the bottom.
There is no guarantee that feature velocity has improved—or even been worked on.
Removing the reward system is a root-cause solution to the dysfunction. Another (lesser) surface countermeasure is the lean-thinking Go See (go see physically at the place of real work) principle and management behavior:
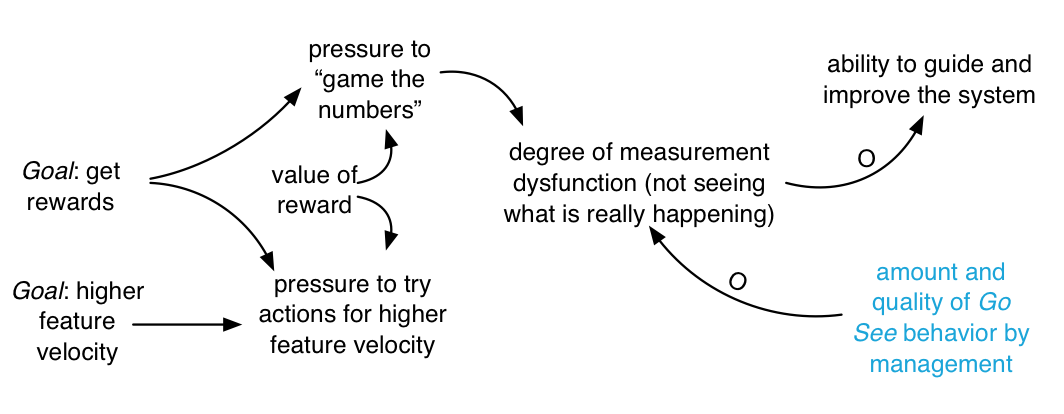
Quick-fix reactions—One difficult and slow solution toward the goal of higher velocity is to hire great developers, to increase coaching and education of existing staff, and to remove terrible workers. The alternative is called a quick fix , a reaction that is hoped to achieve the goal quickly and with less effort. Sometimes a quick fix works well both in the short and long term, really strengthening the system. Sometimes not…hence, “faster is slower.” For example, people may believe that increasing the number of developers increases the feature velocity. And they may thereby hope that hiring more developers will most quickly and easily solve the velocity problem. ‘QF’ indicates the quick fix:
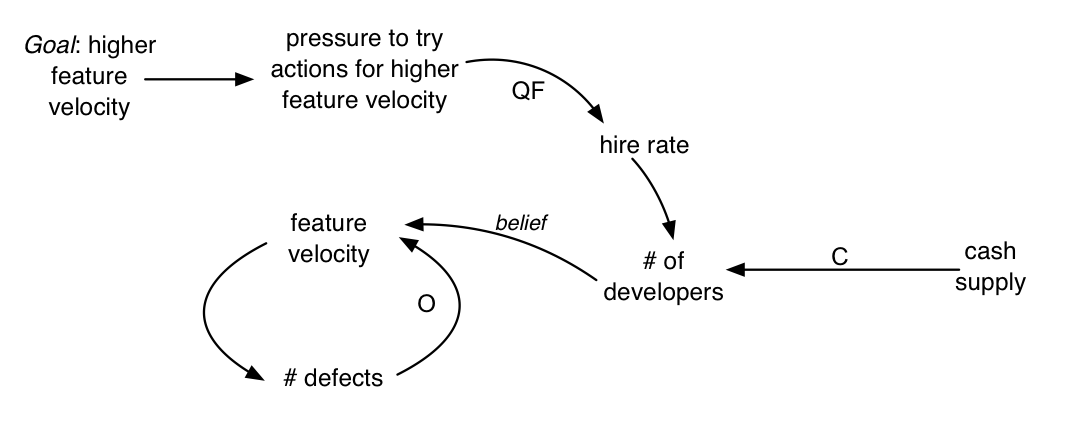
Interaction effects—There is the constraint of cash supply on hiring. One hard and slow solution is to get more cash. A quicker fix is to hire much cheaper developers. In this case, the level of cash supply now has an interaction effect with other causal links. Low cash tends to strengthen the hire rate of much cheaper developers when there is pressure to increase hire rates.
One could simply draw an (opposite) causal link directly from cash supply to hire rate of very cheap developers , but that merely says that less cash leads to more hiring of extremely cheap developers. That is not quite what we want to say; rather, we want to show the interaction effect—that effect A influences effect B. This is done by showing a causal link entering another causal link. For example, from cash supply to the quick-fix line going into hire rate of very cheap developers :
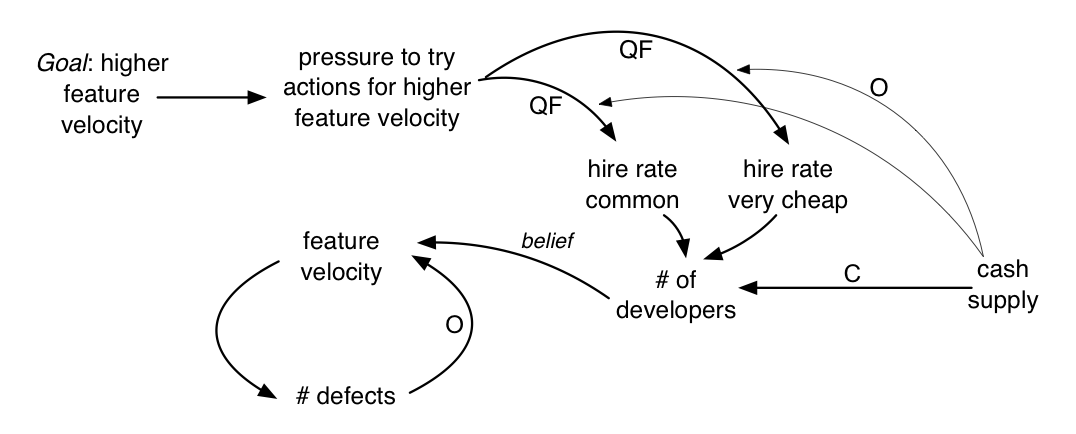
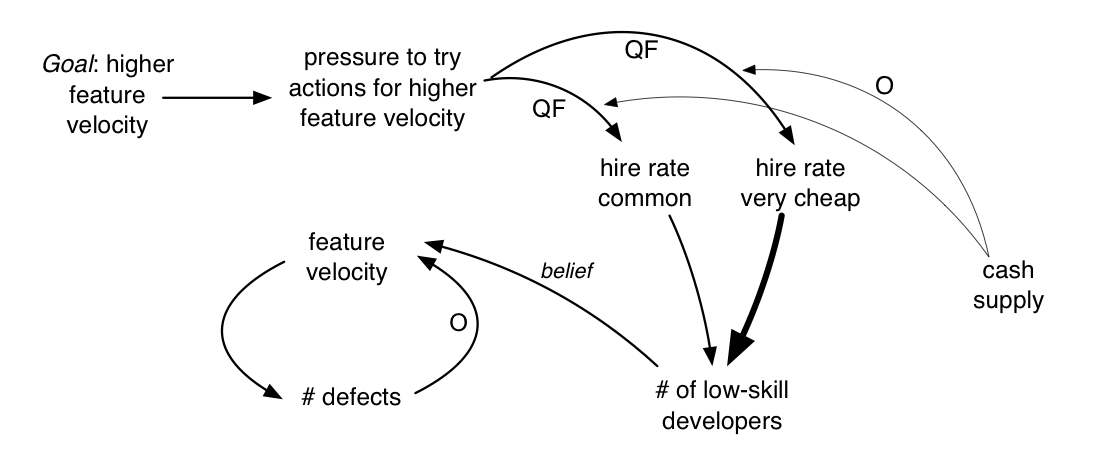
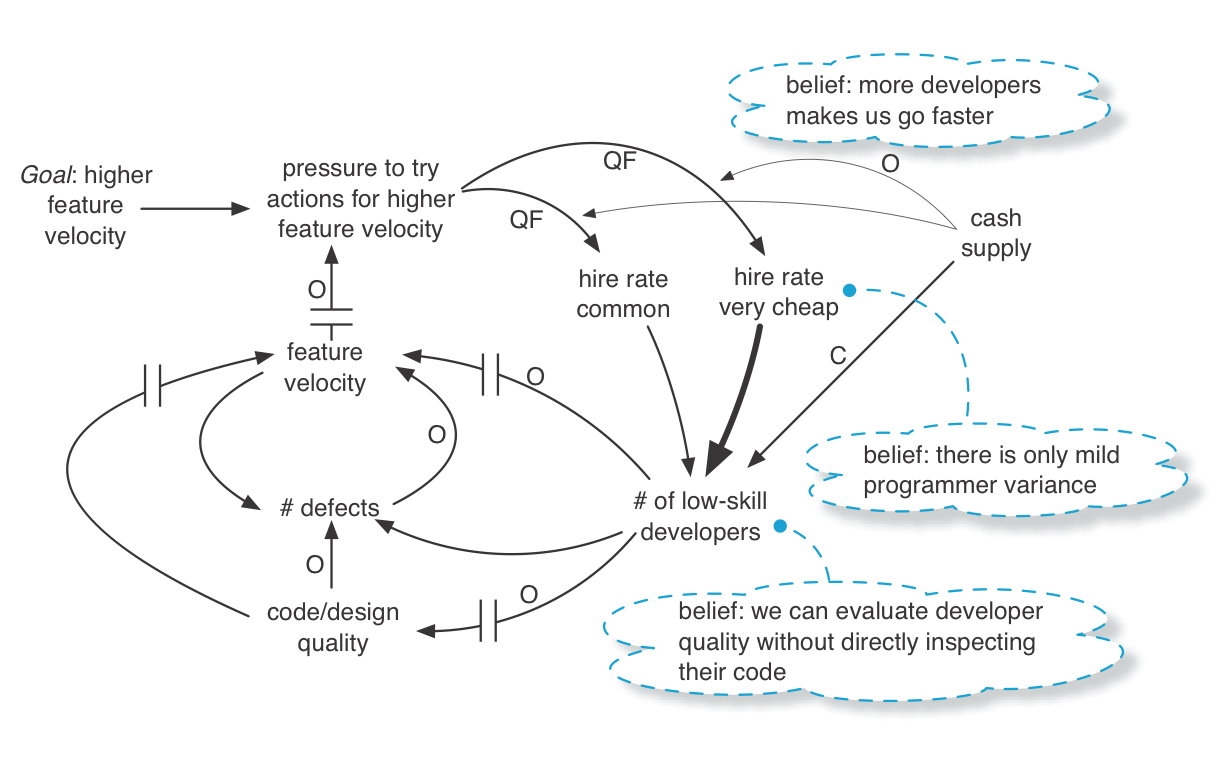
Extreme effects—We have worked with some very inexpensive developers with excellent skill and some very expensive developers that are terrible, but on average, you get what you pay for—when you hire from a large pool of very cheap labor, the average skill level is lower. In the model we want to show that the impact of hiring very cheap labor on the number of low-skilled developers is a significantly greater effect than average.
To show an extreme effect in the model, use a thick line:
Delays—One problem in hiring in software development is the fallacy of mild programmer variance —the mistaken belief that programmer variance (in terms of productivity, code quality, etc.) is relatively small. However, programmer variance studies suggest an average of four times faster in the top versus bottom quartile [Prechelt00]. Rather significant. Also, the COCOMO model—based on large and longitudinal studies—shows that the capability of the development personnel is by far the most important factor for productivity [Boehm00]. And, on average, very weak programmers create poor-quality code (poor design) and more defects, creating another drag on the system.
But the impacts of these effects are not immediately obvious. For example, it takes a relatively long time after hiring a large pool of weak programmers before the impacts of more and more bad code/design start to be felt. Similarly, the average decrease in feature velocity (because of the powerful impact of programmer variance) will not show up immediately.
To show these delayed effects in the model, use a double-line through the effect line:
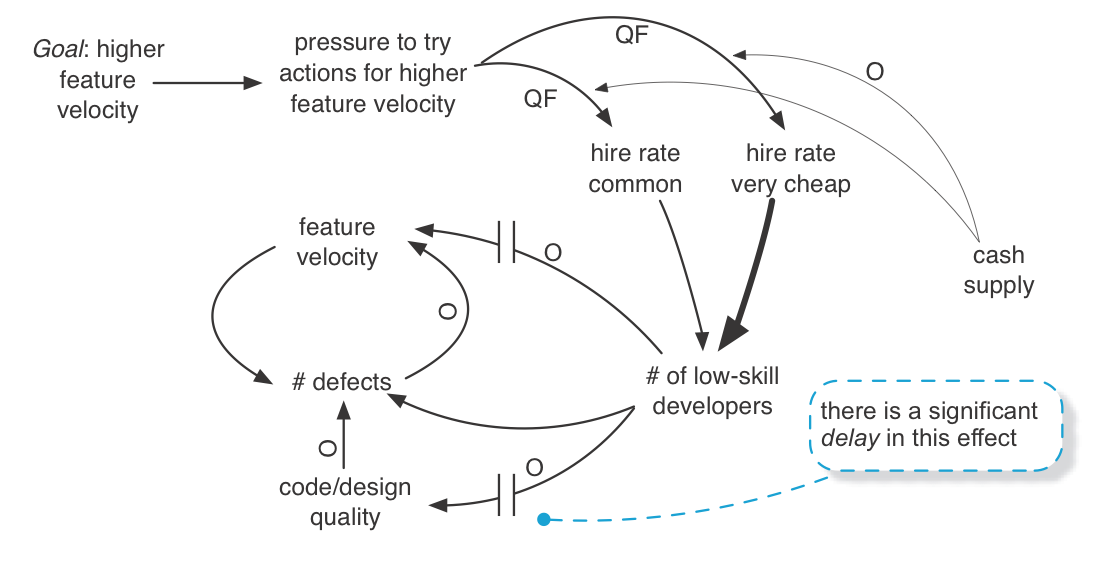
Delay has an intriguing influence on the educational or corrective power in a system. If an impact or unintended consequence is long delayed, one does not feel the effect (pain or gain) and so does not clearly see how A influenced B, or more subtly how A influenced B influenced A .
Therefore, one does not learn from or correct mistakes—in policy, management actions, tools, and so forth. Likewise, gradual improvement through the lean thinking practice of kaizen can take a long time; patience and insight are needed to see if and how things improve.
Positive feedback loops—Negative or positive feedback loops5 and delays are where things start to get more subtle in a system—and in understanding a system. For example, how does one become a better programmer? In part, by mentoring from great programmers and seeing lots of examples of great code. But an office with a lot of low-skill developers does not generate a lot of great code examples, nor does it attract or retain the small pool of great programmers who could act as mentors. They would rather work somewhere else.
Now the development group starts to enter a self-reinforcing downward spiral—a set of positive feedback loops . Fortunately, the downward trend is constrained by the supply of cash.
More great programmers—who could craft great code and mentor others—leave. So there is less and less quality code to look at and to learn from. The percentage of weak programmers grows even larger and feature velocity drops further. Code becomes more messy, awkward, and duplication-riddled, so the capacity to swiftly implement features declines. Since feature velocity is dropping further, there is more pressure to hire yet more very cheap programmers. All this leads to multiple positive reinforcement loops in the system, for example:
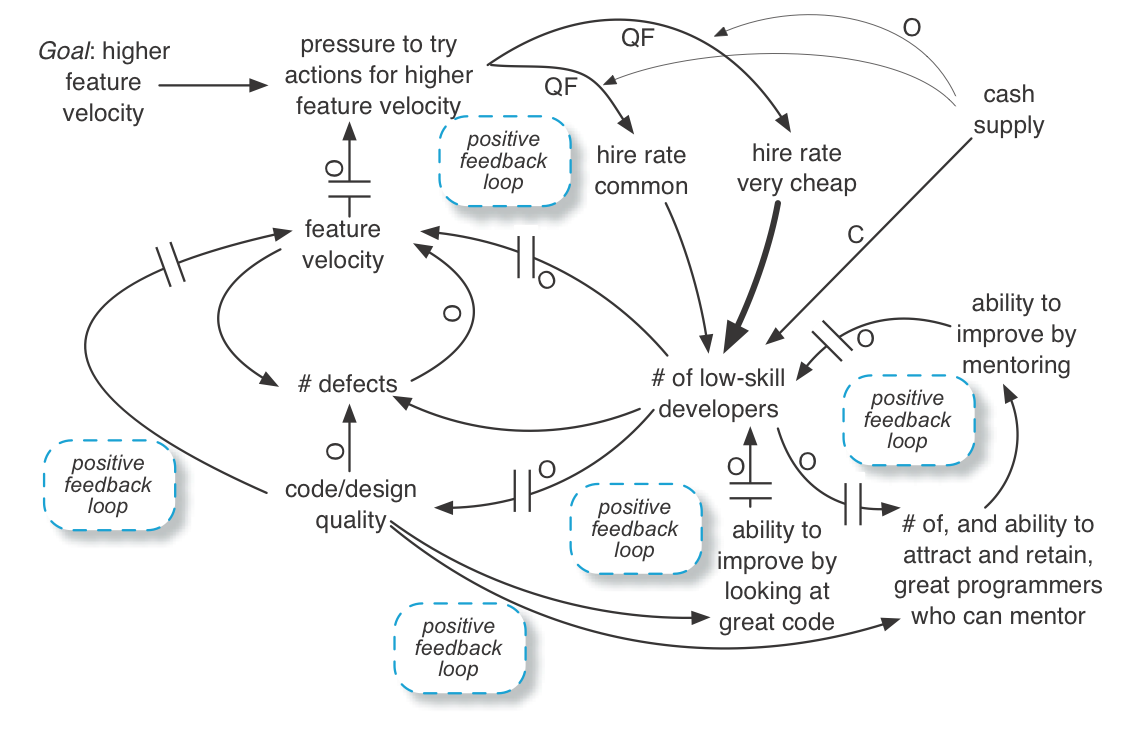
Tip : You can find positive feedback loops by finding cycles with an even number of ‘Opposite’ effect relationships. There are several examples in the model above.
Conclusion
The example scenario is only that—an example. A causal loop diagram can visualize rich dynamics in a workplace system. These are best created by a group at a whiteboard.
Seeing Mental Models
The previous causal loop diagrams reflect people’s mental models of causation, which may be wrong. It is interesting to note that people’s models of causation are influenced by the timeliness (delay) and quality of feedback in the system.
The implication of “mental models” is to improve our meta-cognitive skill to see and question our own assumptions and chains of reasoning. Are we making faulty leaps of logic? It also implies when working with others to discuss (inquiring rather than abusing) the mental models of our colleagues.
Seeing these mental models is step one; changing them is the even harder part of step two. That art is beyond the scope of this introduction, though a successful LeSS adoption must involve changes in mindset and insight among many groups.
A tip to better see the mental models (beliefs, chains of inference, …) playing out in the system dynamics is to ask the following question during a modeling workshop and then sketch the answers. “Let’s talk about the assumptions behind this model. What do we believe or assume in terms of facts and effects that led us here?”
Answers are sketched on the whiteboard model, for example:
Example: The “Faster is Slower” Dynamic
With the vocabulary of quick fixes, delays, positive feedback loops, and mental models, it is fascinating to see that there can be a short-term apparent improvement in a variable as the result of a quick fix, but a delayed degradation of the very same variable—the “faster is slower” dynamic. This is a recurrent dynamic in the workplace and a cause of weakness. So it is worth another illustration.
The story of Microsoft Word and the secret developer toolbox : A classic example of the short-term ‘improving’ but long-term degrading dynamic is the story of the first release of Microsoft Word for Windows [Spolsky04]. It was released years later than desired. Why? Because managers tried to follow the original schedule and pushed developers to meet it .
The story illustrates why wishful thinking is identified as one of the wastes in lean thinking. In this case the wishful thinking of insisting on (apparently) following a schedule, which implies the misconception or wishful thinking that development estimates are not estimates but are commitments—a common myth that propels degradation of a system.
The next model illustrates a summary of the dynamics of what happened when the managers pushed people to evidently keep to the original schedule, and why this quick-fix reaction to slow progress appeared to make things faster in the short term but actually even slower in the long term. See the dynamic of schedule pressure and the secret toolbox. intentionally omits some deeper dynamics that are expanded and shown in See deeper dynamics of schedule pressure and the secret toolbox..
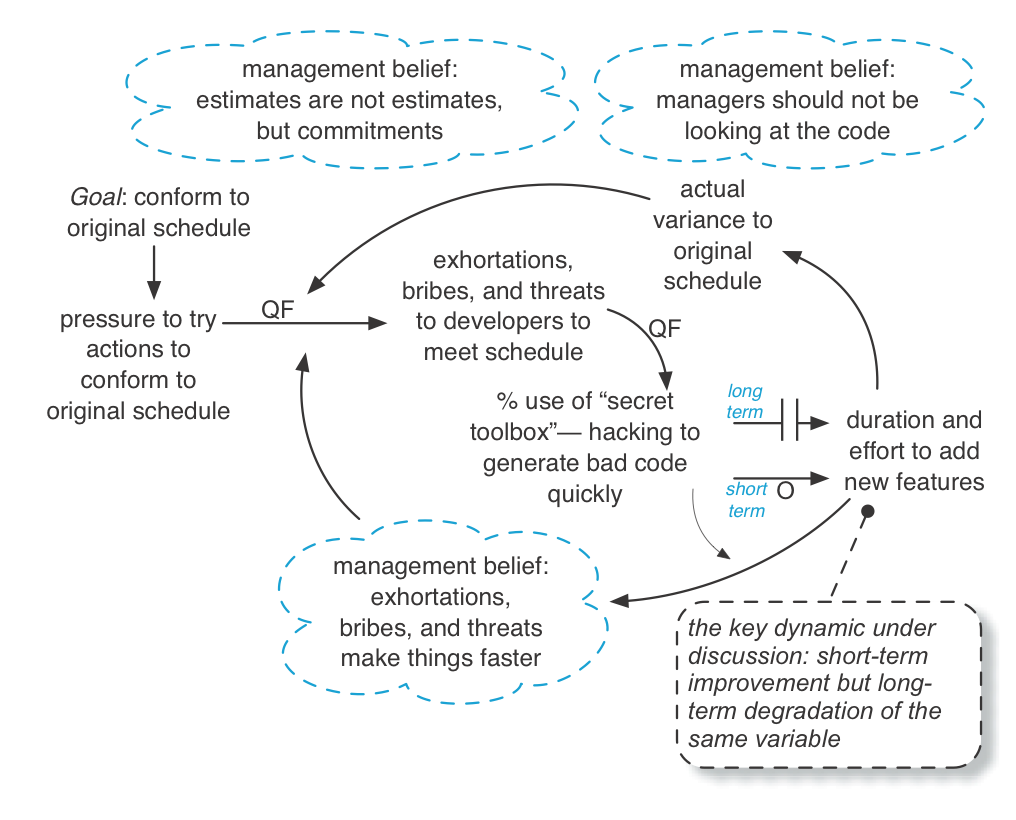
As a quick fix, the Microsoft managers exhorted, bribed (with potential rewards), and threatened the Word developers to keep to the original schedule. Consequently, the developers predictably pulled out their secret developer toolbox —the many practices related to hacking out dirty code (no tests, no reviews, ignore known defects, copy-paste programming, poor design, …) to apparently deliver a feature faster. You see, developers also have quick-fix reactions for their problems.
The tactics seemed to have worked like magic. As the managers pressured the developers, ‘features’ were delivered quicker as people used the secret toolbox, which reinforced the belief that pressuring developers helps. But this apparent acceleration actually had a delayed effect to make things slower, which is explored next. Since management did not quickly see the delayed effect of the secret toolbox, and because they believed managers should not be frequently looking in detail at the source code or themselves be master programmers, they did not learn from this dynamic.
A closer exploration of the system dynamics shows why things went slower in the long term and why the first Word for Windows release was years later than desired, illustrated in this model…
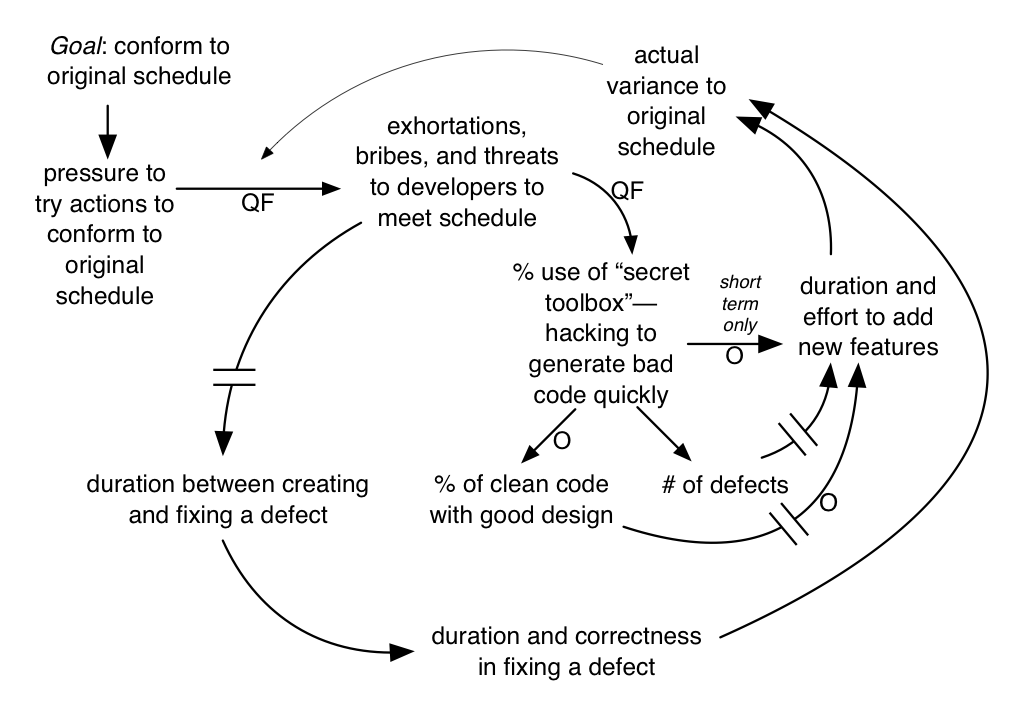
Naturally, lots of dirty code eventually slowed things down. More subtly, developers would ignore the bug list of ever-increasing open defects to—instead—generate new features. This led to a long delay between the creation of a defect and its correction. It turns out that this significantly increases variability and time to fix a defect because of the compounding negative effect of a long-lived bug (for example, due to workarounds and coupling) and because developers have long forgotten the detailed context of code related to the defect and therefore need to slowly rediscover that context—with more and more dirty confusing code surrounding them.
The astute reader may also notice the several positive feedback loops that reinforce the degradation cycle; this is one reason the product was years later than intended.
Solution? The lean thinking Stop and Fix and Go See principles. First , rather than trying to go faster when there are problems, manager-teachers encourage people to go slower and help them learn to see system dynamics and root causes, and to fix these—to improve the system of development. By going slower, Toyota—the masters of lean thinking—has become one of the fastest companies around. Second , for managers to go see at the real place of work to learn what is going on. The “real place” in software development is the code, which suggests that first-level managers are master programmers who are frequently evaluating the code.
Microsoft people did not reflect on the situation until after release. When they did finally hold a retrospective, it led to a zero-defects policy, meaning that the first priority was to fix known bugs in the code under development—to drive down to zero the open-defects list before writing more new-feature code.
Seeing (and Hearing) Local Optimization
“Everyone is doing their best yet overall systems throughput is degrading. How can that be?” This is the paradox of local optimization —when a person or departmental decision maker optimizes for the local view or self-interest. The party making the decision frequently believes they are making the best decision , but because ‘best’ is a local optimization, in fact it sub-optimizes overall system throughput. This is a result of “silo mentality,” misunderstanding, fear, limited information, delayed feedback, ignorance, careerism, avarice, and other common organizational learning disorders .
A small product group of 30 people does not have the time or money to engage in much nonsense or waste. But large companies, with large product groups, centralized process and tool groups, a centralized “project management office,” and so forth, seem to have raised local optimization and waste to an art form. Government bureaucracies are the quintessential example, of course. As such, when you serve as a guide in large-scale agile adoption, seeing (or hearing ) and dealing with local optimization is singularly vital.
For example, the legal and corporate security departments put in place a policy that seems terribly important from their perspective. In the aim of preventing loss of intellectual property (IP), the legal department decrees “no one shall put any information on the walls.” Or, in response to cost-cutting pressure, the facilities management says, “It is important to ensure our walls are not dirty or damaged.” And thus they shut down a practice in lean thinking, visual management (which is usually done on walls), and they inhibit a well-known innovation practice, group whiteboard work. The lawyers may succeed in reducing loss of IP (actually, that is questionable), and the facilities people will succeed in keeping the walls clean—at the cost of inhibiting the product development group from innovating and collaborating. Finally, the company falls behind with less and less IP even worth protecting because tools for innovation and delivering fast have been disallowed, but the lawyers have successfully fulfilled their mandate from the executive team to “ensure our IP is protected.” And the furniture police have clear walls. They have done their best .
The following is a real e-mail quote from the FURNITURE POLICE in one organization that dissallowed visual management on the walls. Can you identify the local optimizations and mental models driving this?
Individual work cubic partition can be personalized. But things obvious higher than the partition or harming the office environment’s harmony are restricted.
We also see local optimization in centralized groups that make software tool choices for others. The common mindset is to choose a tool that is best at reducing some supposed cost (curiously, these groups seldom recommend free open source tools) or best at doing something complicated or best for the work of one specialized worker role (even though everybody has to use the tool), rather than maximizing the global goal of faster system throughput of value to customers.
In large-scale adoption of Scrum or agile principles, most of the “Yes, but …” issues that are raised are examples of local optimization, such as, “Yes, but…what about management reporting?” or more generally, “*Yes, but…what about
Other local optimizations are due to ignorance of new ways of working. This is especially common in large-scale product groups. For example, we once helped a large networking product group in Europe adopt Scrum and the practice of continuous integration (CI) combined with a CI system that continually integrated, built, and automatically tested the product. After some time, an outside traditional manager inspected what was going on, and recommended the integration practices should be changed—because there was no written integration plan for how a human integration manager should manually integrate all the software, and of course, there was no integration manager. They wanted to ‘optimize’ around the work of an integration manager that was no longer needed. They could not see that their entire old-fashioned model of work had been eliminated with CI. This story repeats in all the departments of a large established product: local optimization around the existing ways of work, such as manual test, a separate architecture department, component teams, and so on. A coach working to introduce large-scale Scrum at the enterprise level has a mountain of similar local optimization thinking to deal with.
In lean thinking and agile methods, the focus is on global systems goals: Deliver value fast with high quality and morale—global optimization . Try to consider decisions in light of this goal. To develop an “optimize the whole” culture, challenge all decisions and policies with the question:
Does this decision or policy focus on delivering value to the external customer fast, or does it focus on the interests of a department, person, internal policy/practice, or rare case?
In LeSS, the Product Owner is responsible for choosing high-value goals that could lead to potentially shippable product (at the end of the Sprint) and that maximize the desired impacts and that delight the customer, while maintaining a sustainable pace and high engineering quality. That explicit goal is meant to orient the system toward global rather than local optimization.
Conclusion
In addition to becoming a systems thinker yourself, encourage others to learn more about this topic. We suggest you to try getting together at a whiteboard with colleagues to sketch a causal loop diagram, so that being systems thinkers and doing systems thinking are connected at the workplace.

Recommended Readings
- W. Edwards Deming’s Out of the Crisis is a master work by arguably the most well-known systems thinker and quality expert. It opens with the modest goal, “The aim of this book is transformation of the style of American management… It requires a whole new structure, from foundation upward.” Deming also advocates the System of Profound Knowledge in which managers (1) appreciate there is a system , (2) understand common-cause and special-cause variation (queueing theory is related to variation), (3) understand limitations of knowledge and reasoning mistakes, and (4) know credible psychology and social research results so that behavior- or motivation-related policies are not based on “common sense.” The core of the book centers around his famous 14 Points for Management , including (for example), “Eliminate management by objective. Eliminate management by numbers, numerical goals. Substitute leadership .”
- Jay Forrester’s Industrial Dynamics is the classic text on system dynamics—well written and insightful. Although written in the early 1960s, it is as relevant today as when published. It goes beyond cause-effect modeling to also model the flow and inventories of information, money, and material in systems. The book includes formal mathematical modeling but this is not obligatory to appreciate system dynamics.
- Weinberg’s Quality Software Management: Systems Thinking and An Introduction to General Systems Thinking are worthwhile. Written from the perspective of an experienced consultant in systems development.
- Senge’s The Fifth Discipline is a classic that advocates the need for leadership to apply systems thinking (it is the fifth discipline) and other key disciplines for a great, sustainable enterpise. The others include leaders with (1) personal mastery and (2) reflection on their beliefs and faulty reasoning, the (3) definition and communication of a meaningful shared vision, and (4) the ability of teams to learn. We recommend ignoring—at least during the first few years of practice—the ‘archetypes’ notion presented in the book. It was well meant as a learning aid but has been observed to distract and intimidate people from learning and applying basic system dynamics modeling. The ‘archetypes’ are not part of original system dynamics.
- The Fifth Discipline Fieldbook is an in-depth resource, written from the viewpoint of many practitioners and consultants.
- The organizational-learning writings from Argyris, Putnam, McLain, and Schön. Important concepts include double-loop learning and high-advocacy/high-inquiry dialogue. Classic works include Action Science and Organizational Learning.
- The publications and resources available through the Society for Organizational Learning.
Notes:
1. Senge wrote The Fifth Discipline , on systems thinking and learning organizations, named “one of the seminal management books of the last 75 years” by the Harvard Business Review. See** [Senge94].
2. Another reason: Believing more control is possible than actually is. Complexity science suggests fundamental limits on predicting and controlling semi-chaotic social systems [Stacey07]. This is a rather large can of worms that will remain unopened in this book.
3. Macroeconomics, psychology, sociology, and biology are exceptions, among many others.
4. ‘Basic’ does not mean trivial or easy to solve. For example, ‘motivation’ and ‘quality’ are basic but not easy issues.
5. Feedback loops is occasionally used in this book in the colloquial sense of feedback, rather than this system dynamics sense.
