Tracking Sprint Progress
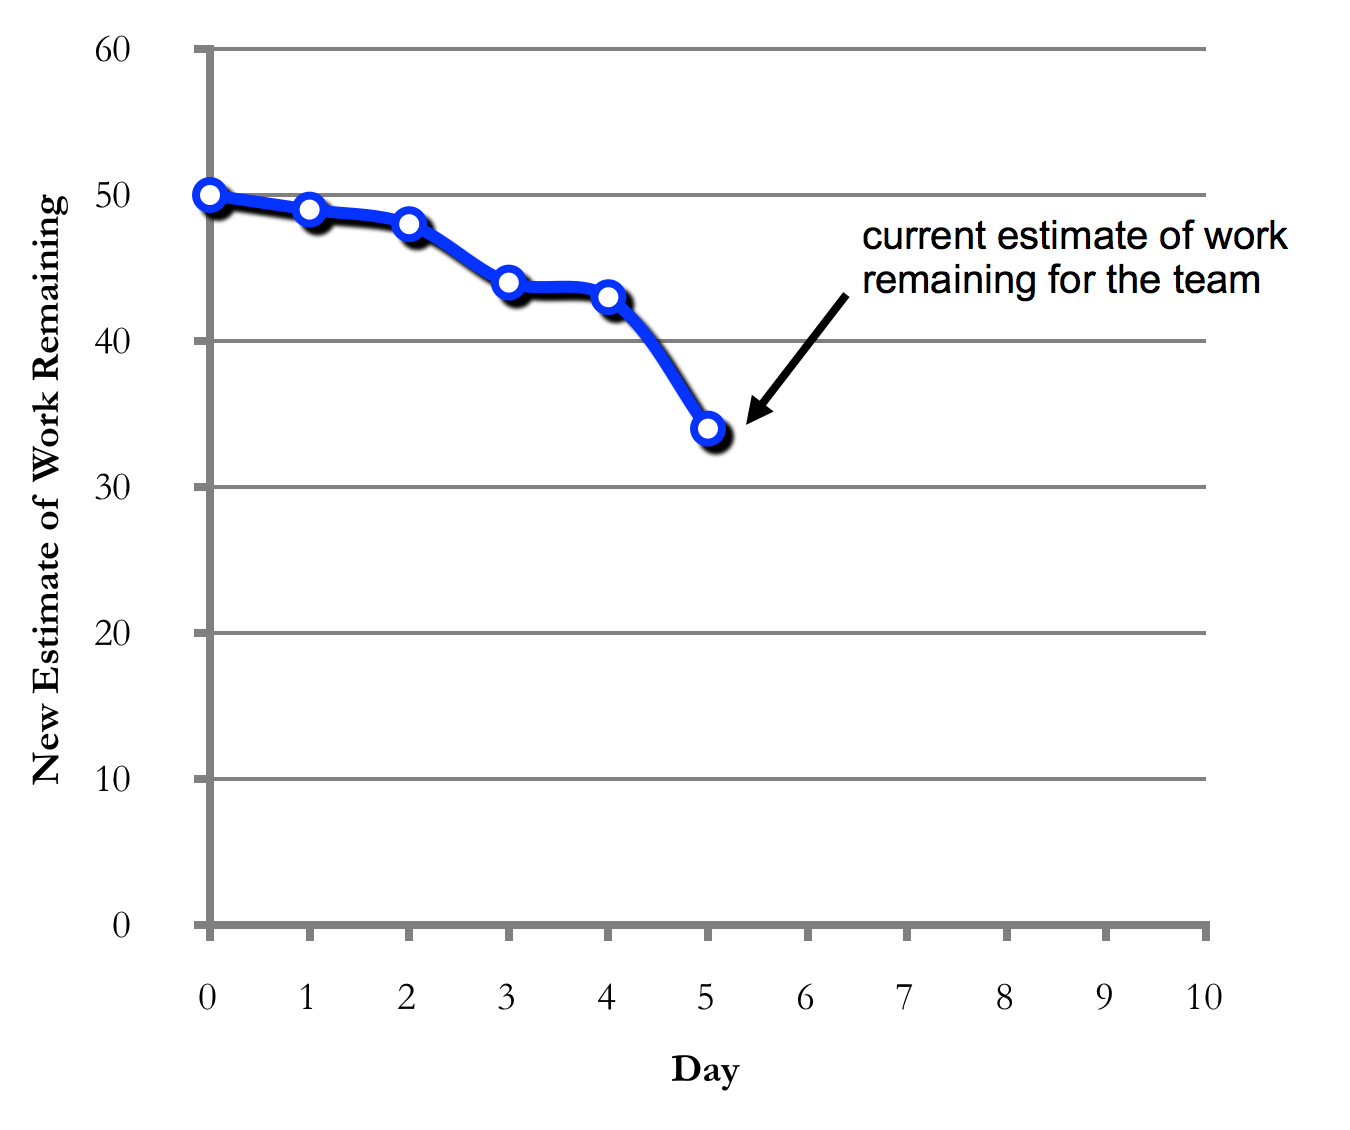
The Team in Scrum is self-managing, and in order to do this successfully, it must know how it is doing. Every day, the Team members update their estimate of the effort remaining to complete their current work in the Sprint Backlog (Figure 6). It is also common for someone to add up the effort remaining for the Team as a whole, and plot it on the Sprint Burndown Chart (Figure 7 and Figure 8). This graph shows, each day, a new estimate of how much work remains until the Team is finished. Ideally, this is a downward sloping graph that is on a trajectory to reach “zero effort remaining” by the last day of the Sprint. Hence it is called a burndown chart. And while sometimes it looks good, often it does not; this is the reality of product development. The important thing is that it shows the Team their progress towards their goal, not in terms of how much time was spent in the past (an irrelevant fact in terms of progress), but in terms of how much work remains in the future – what separates the Team from their goal. If the burndown line is not tracking downwards towards completion near the end of the Sprint, then the Team needs to adjust, such as to reduce the scope of the work or to find a way to work more effectively while still maintaining a sustainable pace.
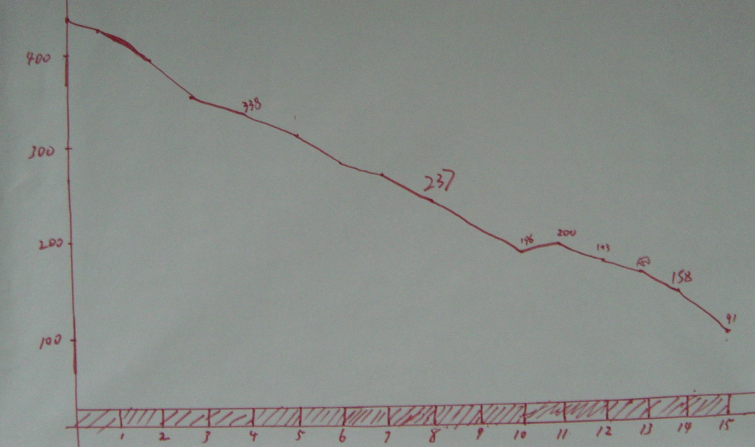
While the Sprint Burndown chart can be created and displayed using a spreadsheet, many Teams find it is more effective to show it on paper on a wall in their workspace, with updates in pen; this “low-tech/high-touch” solution is fast, simple, and often more visible than a computer chart.
| Product Backlog Item | Task | Volunteer | Initial Estimate of Effort | New Estimates of Effort remaining at end of day... | |||||
|---|---|---|---|---|---|---|---|---|---|
| 1 | 2 | 3 | 4 | 5 | 6 | ||||
| As a buyer, I want to place a book in a shopping cart | modify database | Sanjay | 5 | 4 | 3 | 0 | 0 | 0 | |
| create webpage (UI) | Jing | 3 | 3 | 3 | 2 | 0 | 0 | ||
| create webpage (javascript logic) | Tracy and Sam | 2 | 2 | 2 | 1 | 0 | 0 | ||
| write automated acceptance tests | Sarah | 5 | 5 | 5 | 5 | 5 | 0 | ||
| update buyer help webpage | Sanjay and Jing | 3 | 3 | 3 | 3 | 3 | 0 | ||
| ... | |||||||||
| Improve transaction processing performance | merge DCP code and complete layer-level tests | 5 | 5 | 5 | 5 | 5 | 5 | ||
| complete machine order for pRank | 3 | 3 | 8 | 8 | 8 | 8 | |||
| change DCP and reader to use pRank http API | 5 | 5 | 5 | 5 | 5 | 5 | |||
Figure 6. Daily Updates of Work Remaining on the Sprint Backlog